In this section, it will be assumed that you have the signal presented in the previous section (see figure Figure 3.1, “A signal and the FFT dialog box for a plot.”). We can analyze this signal by doing a FFT on the data curve and it will show that this signal has a power spectrum with high and low frequencies (see figure Figure 3.2, “The resulting FFT with the characteristic frequencies.”). The newt sections will show the influence of the different filters on this data curve.
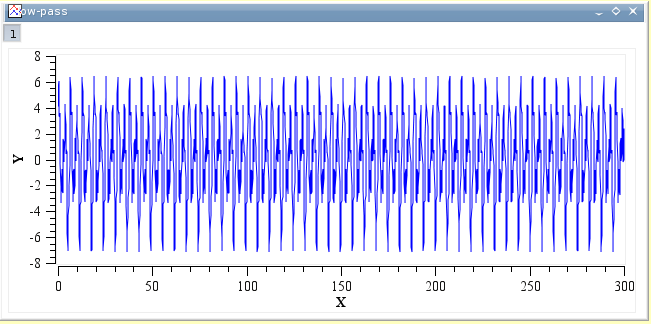
This filter allows to cut the high frequencies of a signal. You just have to select the cut-off frequency of the filter. Let us assume that we want to keep the frequencies below 1.5 Hz, we will obtain:
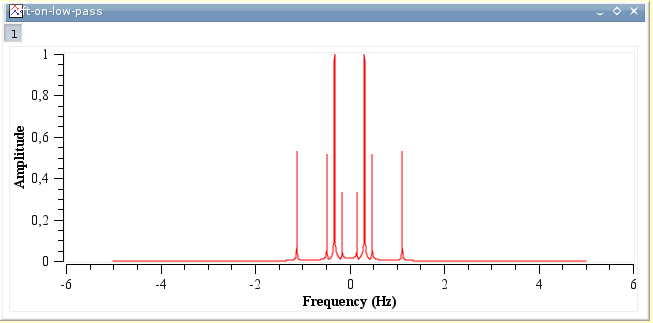
The power spectrum of this new signal shows that the frequencies below 1.5 Hz have been kept.
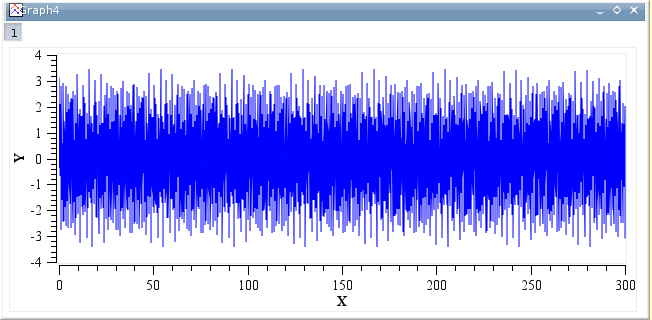
This filter allows to cut the low frequencies of a signal. You just have to select the cut-off frequency of the filter. Let us assume that we want to keep the frequencies above 1.5 Hz, we will obtain:
The power spectrum of this new signal shows that the frequencies above 1 Hz have been kept.
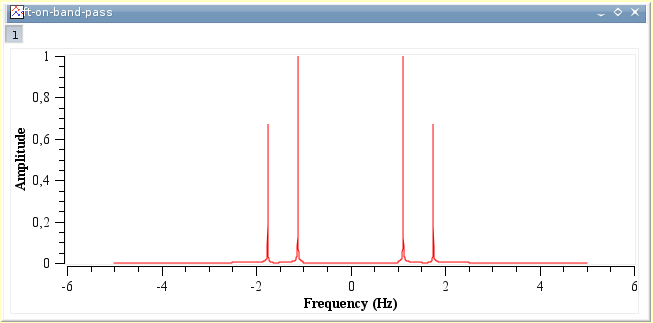
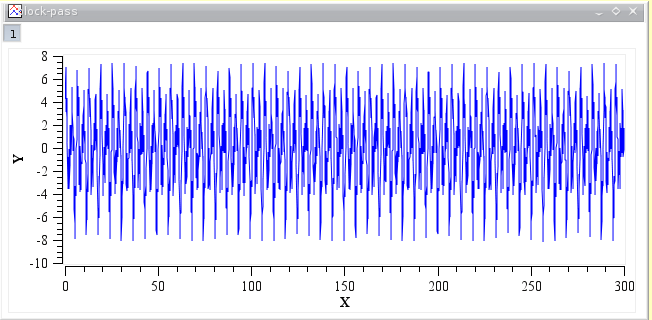
This filter allows to cut the low and high frequencies of a signal. You just have to select the high and low cut-off frequencies of the filter. Let us assume that we want to keep the frequencies between 1.5 and 3.5 Hz, we will obtain:
The power spectrum of this new signal shows that only the frequencies at 1.5 and 3.5 Hz have been kept.
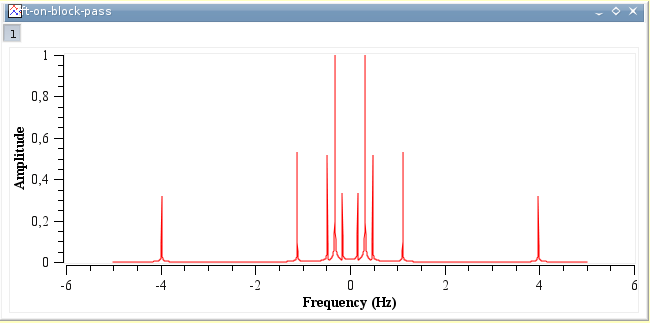
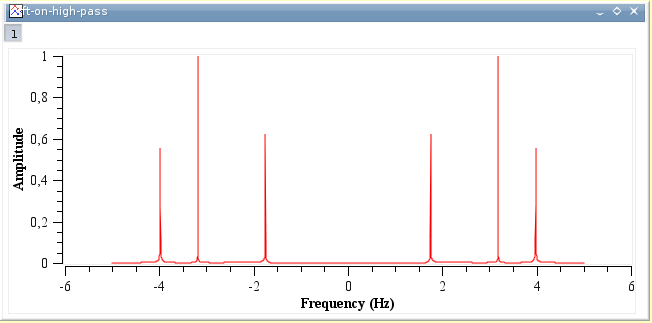
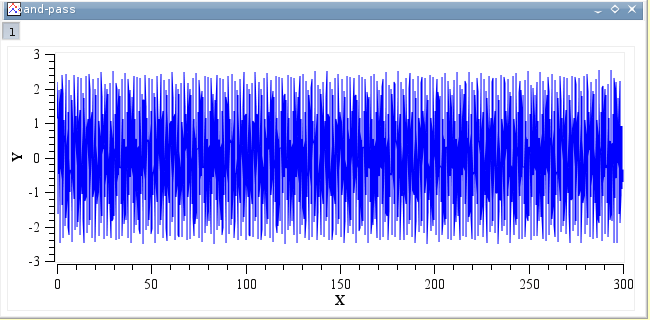
This filter allows to keep the low and high frequencies of a signal. You just have to select the high and low cut-off frequencies of the filter. Let us assume that we want to remove the frequencies between 1.5 and 3.5 Hz, we will obtain:
The power spectrum of this new signal shows that only the frequencies below 1.5 Hz and above 3.5 Hz have been kept.