This toolbar is only active when a plot window is selected. It allows the quick access to the commands of the Graph menu which are used for the modification of the plots and of the data points of the plots.
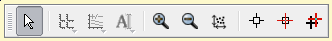
Table 6.4. Plot toolbar commands
| Icon | Command | Key | Description |
|---|---|---|---|
| Disable Tools command | Comes back to the normal pointer mode, this is useful when you have select other modes of the plot window such as the data reader. | ||
| Access to the layers commands. | |||
| Arrange Layers command | ALT+A | Arranges the different layers of the active plot window. | |
| Add Layer command | ALT+L | Adds a new layer to the active plot window, or remove a layer from the selected plot window. | |
| Access to the curves sub-menu. | |||
| Add/Remove Curve command | ALT+C | Adds or removes curves to the active plot window. | |
| Access to the commands for addition of graphics objects to the current plot. | |||
| Add Text command | ALT+T | Add a new text element in the active plot. | |
| Zoom In command | CTRL++ | Switches the active plot layer to the zoom mode. | |
| Zoom Out command | CTRL+- | Switches the active plot layer to the zoom mode. | |
| Rescale to Show All command | CTRL+SHIFT+R | Reset the zoom in order to show all the data. | |
| Screen Reader command | Switches the active plot layer to the Screen Reader mode. | ||
| Data Reader command | CTRL+D | Switches the data display mode. | |
| Select Data Range command | ALT+S | Switches the active plot to the Select Data Range mode. | |