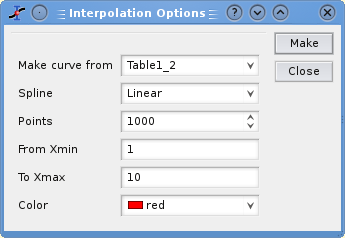
The interpolation command will create a new data curve with a high number of points by interpolation of your data. The dialog box allows to define this number of points (default value = 1000). Then the method used for interpolation, the interval of X-values and the color of the interpolated curve can be chosen. In addition to the new curve in the active plot, a new table will be created.
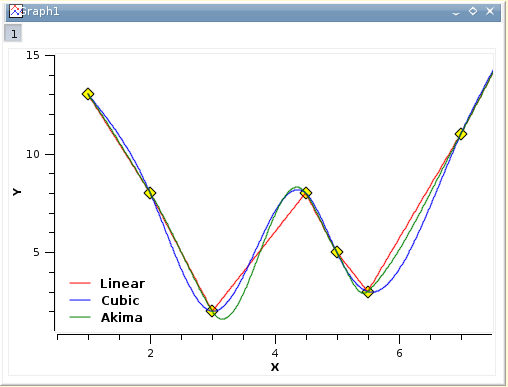
The simplest interpolation method is the linear method. In this case, a linear variation is used to compute the data points between two values. The cubic method will use the Cubic Splines method (in this case at least 4 points are needed). The last method Akima is a polynomial interpolation. You can refer to the corresponding section of the GNU Scientific Library for more details.