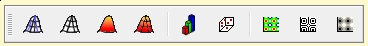
Table 6.6. 3D Plot toolbar commands.
| Icon | Command | Key | Description |
|---|---|---|---|
| 3D Wire Frame command | Draw a surface with the wireframe style. | ||
| 3D Hidden Lines command | Draw a surface with the mesh style (with hidden lines). | ||
| 3D Polygon command | Draw a surface with the polygons style. | ||
| 3D Wire Surface command | Draw a surface with the mesh+polygons style. | ||
| Bar Style command | Changes the styles of the bars. | ||
| 3D Plots→Scatter command | Draw data points as a clouds of points in a 3D space. | ||
| Contour+Color Fill command | Draw data points as a map with a color filling between isolines. | ||
| Contour Lines command | Draw data points as a map with isolines. | ||
| Gray Scale Map command | Draw data points as a map with a gray palette filling between isolines. |