This menu is only active when a matrix is selected.
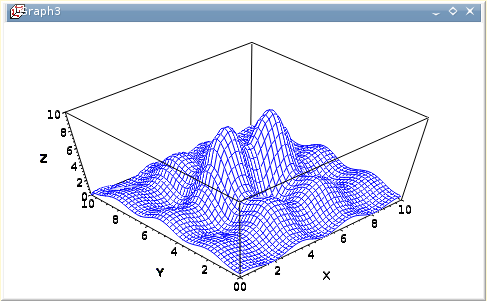
- 3D Wire Frame
-
Makes a 3D plot of the selected matrix using the "3D mesh" style.
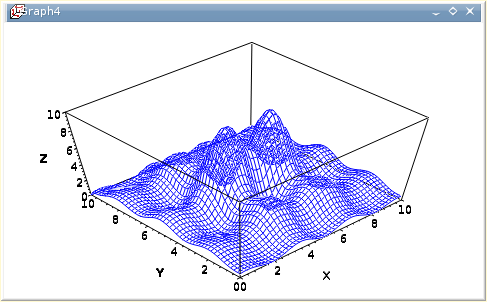
- 3D Hidden Lines
-
Makes a 3D plot of the matrix using the "3D mesh" style with hidden lines.
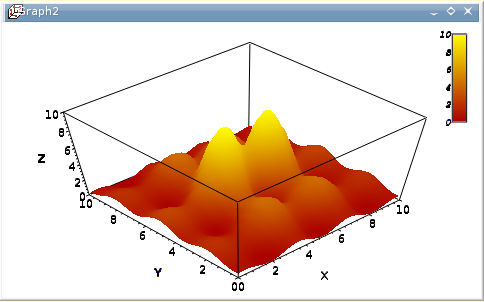
- 3D Polygon
-
Makes a 3D plot of the matrix using the "3D polygons" style.
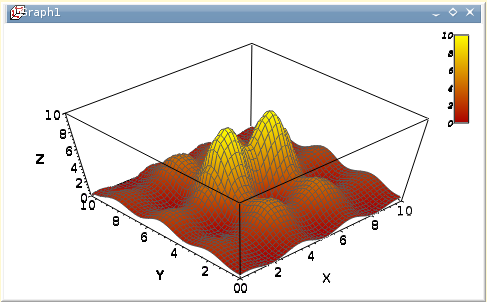
- 3D Wire Surface
-
Makes a 3D plot of the matrix using the "3D polygons" style with the mesh drawn.
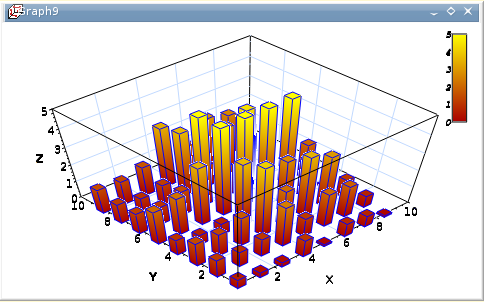
- 3D Plots→Bars
-
Makes a 3D plot of the selected data column in the active table window (only one column allowed) using the "3D Bars" style.
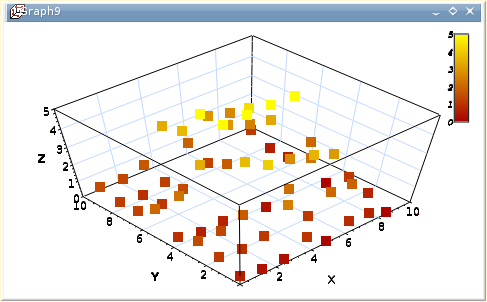
- Scatter
-
Makes a 3D plot of the selected data column in the active table window (only one column allowed) using the "3D Dots" style. The 3D point symbol style can be changed via the 3D Plots Settings dialog.
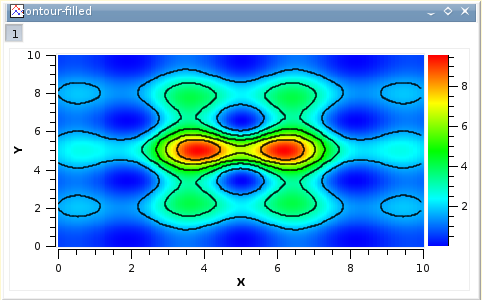
- Contour+Color Fill
-
Makes a color map plot of the data in the active matrix window. The contour lines and the colormap settings may be changed by clicking on the plotting area, this will active the Contour Options Dialog.
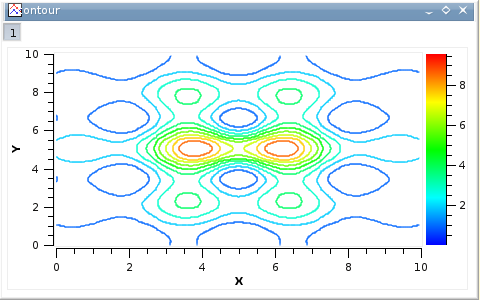
- Contour Lines
-
Makes a contour plot of the data in the active matrix window. The contour lines and the colormap settings may be changed by clicking on the plotting area, this will active the Contour Options Dialog.
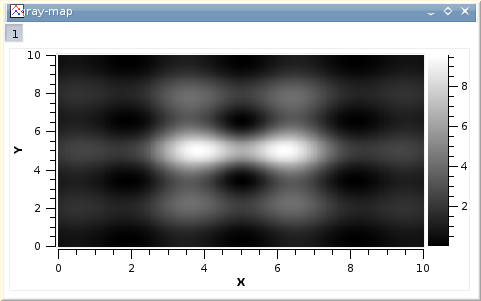
- Gray Scale Map
-
Makes a gray map plot of the data in the active matrix window. The contour lines and the colormap settings may be changed by clicking on the plotting area, this will active the Contour Options Dialog.