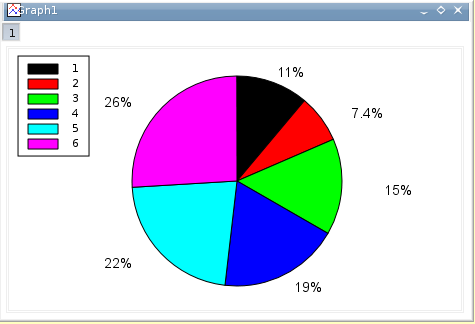
A pie plot can be built from two columns in a table, the first column will be considered as text and the second as numbers. By default, each sector of the plot will have one label containing the percentages computed from the Y values. Theses labels can be modified as any other text label.
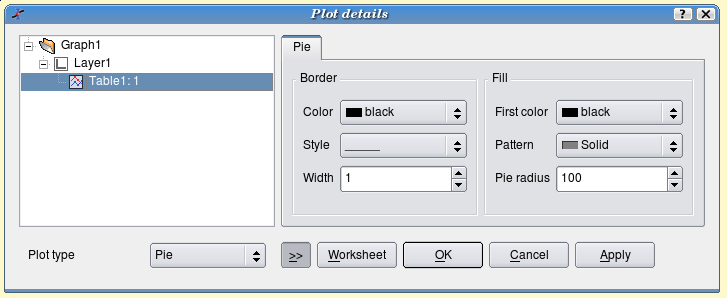
These commands are available for the plots generated by the Pie command. The first tab allows the customization of the pie segments. The left fields are used to modify the border which is drawn round each segment: color, type and width of line. The default is no border (line width = 0).
The right fields are used to define the filling of the plots. The color button defines the one used for the first segment, then the others segments will have colors which follow the order defined in the list. The default value for this field is black, so segment 2, 3, etc will be red, green, etc.
The pattern will be used for all segments of the pie, the default value is solid filling. The last field defines the size of the pie in pixels.
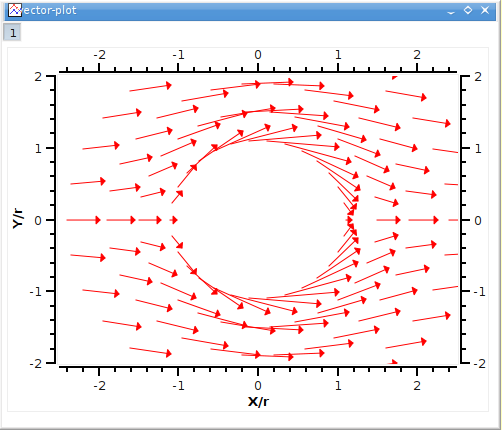
A vector plot can be built from four columns in a table. The two first columns define the position of each arrow in the X-Y drawing area. The two other columns define the length of the arrows, two methods are available for this:
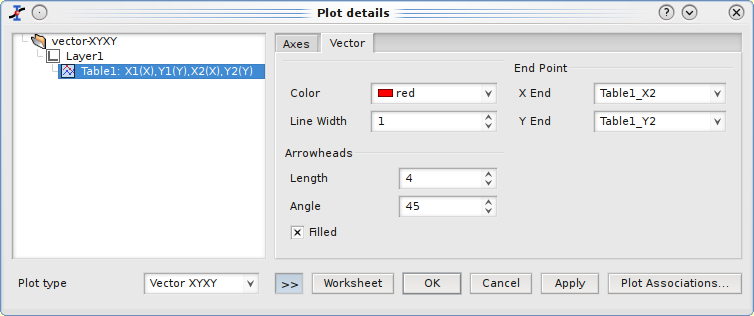
Vector-XYXY: the two last columns define the position of the arrow while the two first columns define the origin of the arrow.
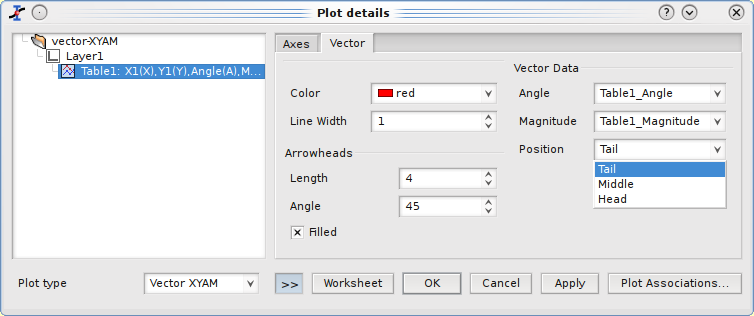
Vector-XYAM: the two last columns define the angle and the magnitude of the arrow. In this case, the two first columns define the position of the arrow by its origin, its center or its end depending on the options used (see below).
In the case of a Vector-XYXY plot, the options window allows to modify the shape and size of the arrow head, and also the linestyle used to draw the arrows.
In the case of a Vector-XYAM plot, the options are the same as above. In addition, the relative position of the arrow as a function of the X-Y values can be specified.