This menu is only active when a plot is selected. Refer to the Chapter 2, Drawing plots with SciDAVis for a tutorial on the formatting of 2D or 3D plots.
- Plot
-
2D plot
This command is used to set some general graphic parameters of the different layers and of the curves. Refer to the the section called “"Plot details" window”.
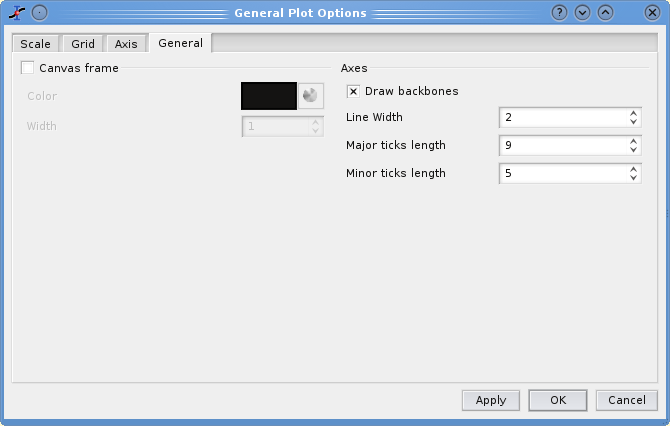
In addition, you can specify some global parameters of the plot with the format dialog with the General tab selected. The canvas is the area defined by the axis, you can draw a box around this canvas and define a background color for this canvas. The background area is the global drawing area, you can also define a color border and a background color for this area. The margin parameter controls the distance between the drawing area limit and the canvas. If you want to modify the margin between the window limits and the drawing area, you must modify the layer parameters (manualy with the mouse or with the Arrange Layers command.
The parameters in the Axis group allow to modify the linestyle of the axes and of the ticks.
3D plot
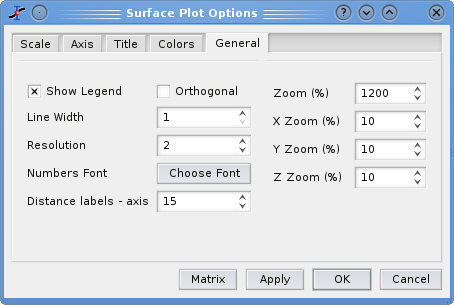
In the case of a surface plot, this command opens the surface plot options with the General plot options tab selected. In this case the aspect ratio of the plot can also be modified. The default behaviour is to use the perspective to compute the 3D plot. If you choose to check the Orthogonal check box, the plot will use vertical Z axis whatever the view angle of the plot.
- Scales
-
2D plot
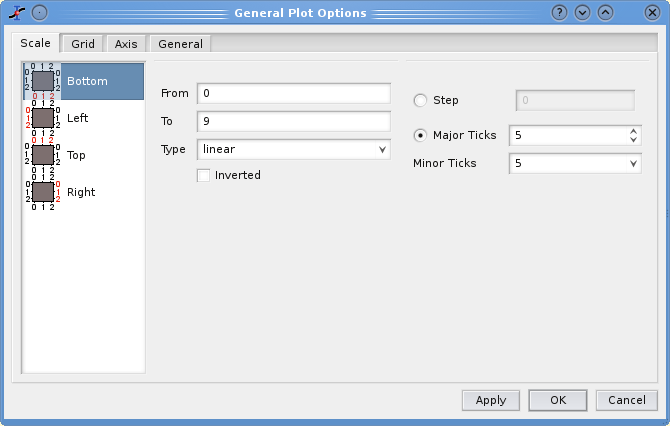
Opens the format plot dialog with the scales tab selected. It allows to customize the ranges of the differents axes. It must be reminded that any modification in the table or in the plotted curves will result in a reset of these scales to the default values.
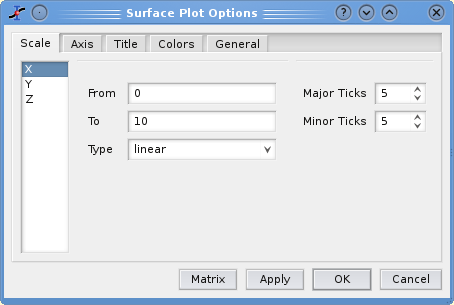
In the case of a surface plot, this command opens the surface plot options with the scales options tab selected.
In this tab, you can also set the number of ticks used for each axis. This can be done in two ways: you can set the number of labels which are used for the whole scale. Whatever the number you enter, SciDAVis will use a value which leads to a pretty plot: for example, if you enter 7 ticks for a 0..100 scale, SciDAVis will use 10 major ticks from 10 to 10. If you want to fix non classical values, you can select the step method.
3D plot
The first tab is used to modify the X, Y and Z ranges. It allows also to specify the number of labels on the axis and the number of secondary ticks.
- Axes
-
2D plot
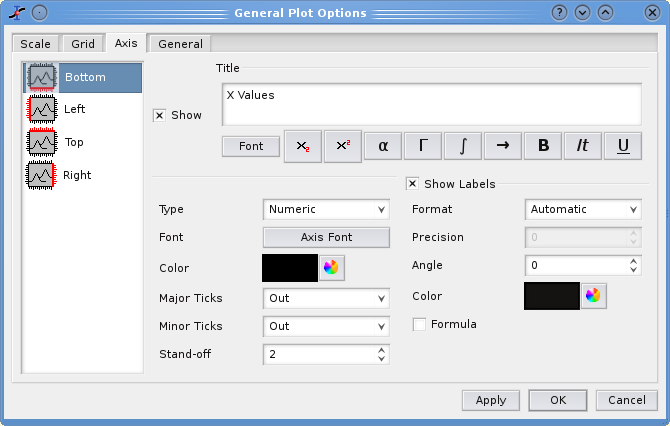
Opens the format plot dialog with the axes tab selected. It allows to customize the settings for the different axes such as the size and color of axes and ticks, the label of the axes, etc. The third tab is used to modify the setting of the different axis. You must select the axis that must be customized in the right window. The label of the axis can be modified in the title window, see the text dialog section for more details.
3D plot
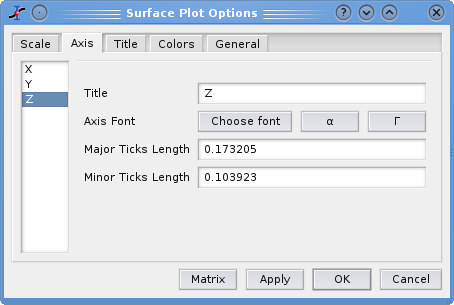
In the case of a surface plot, this command opens the surface plot options with the axis options tab selected.
The second tab defines the main parameters of the three axis: the axis label and its font, and the length of the ticks. This length is defined in the same units as the range of the axis. If something is changed in the scales of the graph, the length of the ticks is re-calculated by SciDAVis. The font button allows to modify only the font used for the label, if you want to customize the font of the numbers used for the axis, you must used the fifth tab.
- Grid
-
2D plot
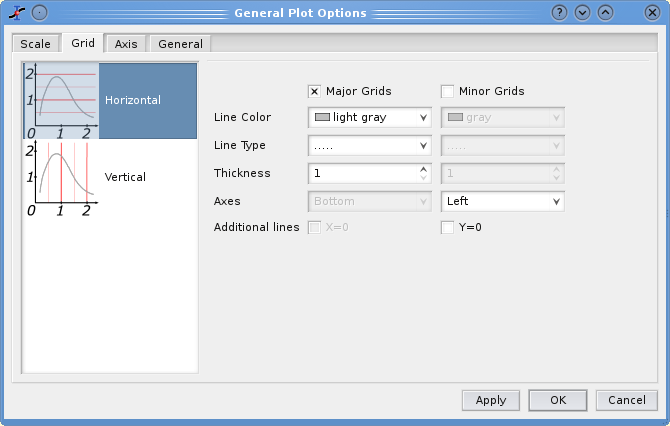
Opens the format plot dialog with the grid tab selected. It allows to add and customize grid lines on the different axes. The grid tab is used to draw grid lines on the plot. The frequency of the lines are related to the number of label and major ticks set with the Scale tab.
If the selected plot is a surface plot, this menu item is not showed.
- Title
-
2D plot
Opens a text dialog, allowing you to modify the title of the plot and its properties (color, font, alignement). See the the section called “Adding a text label”.
3D plot
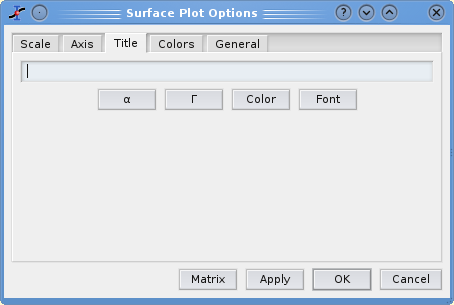
In the case of a surface plot, this command opens the surface plot options with the title options tab selected. You can not add subscripts, superscripts, bold characters, etc in your title as you can do it for 2D plots.