The multilayer windows can contain multiple plots (layers) with different characteristics. Each layer has a corresponding button, which displays a number and is pressed when the layer is the currently active layer. There is only one active layer at a time, and the plot tools (zoom, cursors, drawing tools, delete and move points) can only operate on this layer. Each plot can be made active by clicking on it or on its corresponding button.
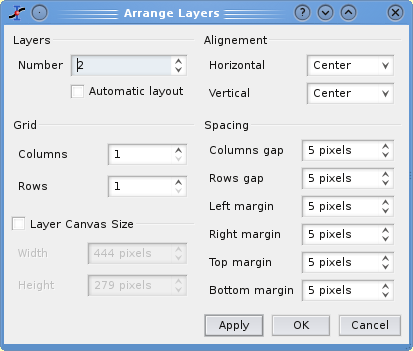
To arrange the layers use the Arrange Layers command. You can add or remove layers with the Add Layer command and Remove Layer command or copy/paste layers from one multilayer window to another. All these functions can be reached via the Graph menu, by using the Plot toolbar or via the context menu (right click in the multilayer window anywhere outside a plot area).
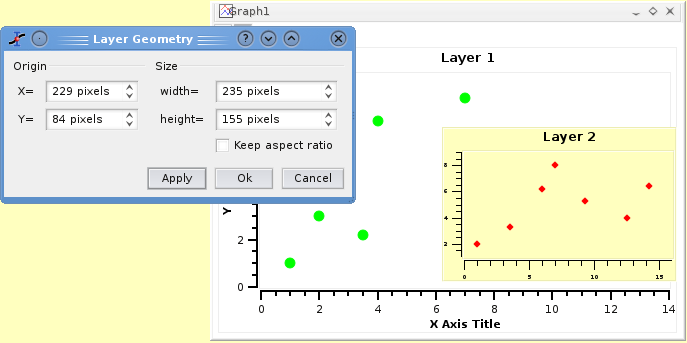
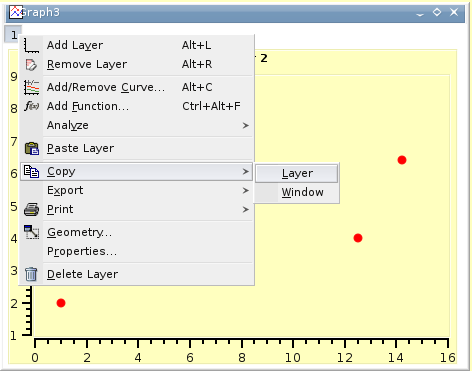
You can resize and move a layer using the Layer geometry dialog. You can also arrange and resize the plots by hand. A whole plot can be moved by drag and drop: click on the plot and keep the left mouse button pressed.
By keeping the Shift key pressed and dragging the border of a plot you can scale a plot as needed. When moving the mouse over the borders of a plot, you will see the corresponding arrows.
You can also use the mouse wheel in order to resize the layers: keeping the Ctrl key pressed and scrolling will resize the hight of the plot canvas, while keeping the Alt key pressed and scrolling will resize its width. By keeping the Shift key pressed and scrolling you can resize the plot in both dimensions.
This is the simplest way to obtain a multilayer plot. It can be used if you want to build a panel of plots with a simple arrangement: 2 plot in a row or in a column, or 4 plots in 2 rows and 2 columns.
You can select two columns with Y-values in a table, and then use one of the Panel commands in the Plot menu. SciDAVis will create a panel of plots in which the size of the different elements of each plot are synchronized.
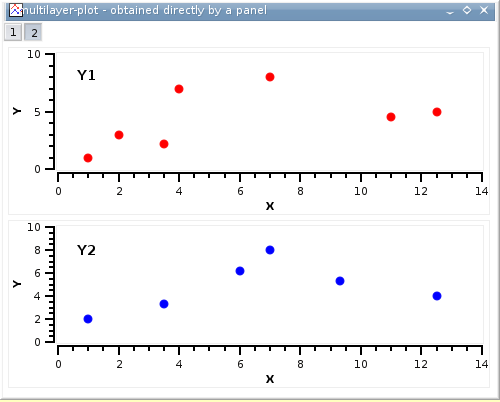
You can then customize the two plots, if you want to change the arrangement of the panel, you can use the Arrange Layers command from the Graph menu. It must be reminded in this case that each plot is in a layer with a surface which is the half or the quarter of the window surface area. So, if you want to share an element between the two plots (for example a text label), you need to add it in a new layer (see the Add Text command for more detaile).
If you need to build a more complex multilayer plot, you can define it step by step.
The first step is to build your first plot, for example from two columns of a table. We obtain a standard plot window:
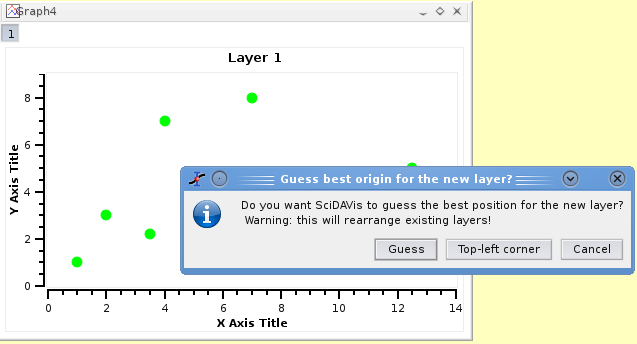
Then, select the plot window and use the Add Layer command from the Graph menu. This will activate a dialog box. If you choose "Guess" you will obtain a panel with two columns, if you choose "corner" you will obtain two superposed layers. If you want to build a panel with two rows or some other regular matrix of plots, you can use the Arrange Layers command to convert the plot to a panel.
If you want to build a more complex geometry like plots inserted in another one, you can modify the geometry of each plot with the layer geometry command. This command is accessible with the context menu of the layer and it allows to modify the size and the position of each layer. Beware that by default, the background of the different layers are not transparent. Therefore, you must modify this parameter if you want to have some superposition of plots. This modification can be done with the Plot command of the Format menu.
For each layer, you can use the Add/Remove Curve command to select the X and Y values from one of the tables of the project.
After this, you can customize your plot. At the end, the modifications done on the axis or on the axis labels may have modified the geometry of the two plots. You can synchronize again the two plots by applying again the Arrange Layers command.