- Edit → Undo (CTRL+Z)
-
Undo the last command done on tables or matrix. It can also be accessed by clicking on the
 icon of the edit toolbar. The list of commands which are in the stack can be seen with the Undo/Redo History command.
This command is not available for plot windows.
- Edit → Redo (CTRL+R)
-
Restores the modifications in a table after a "Undo" operation. It can also be accessed by clicking on the
 icon of the edit toolbar. The list of commands which are in the stack can be seen with the Undo/Redo History command.
This function is not available for plot windows.
- Edit → Cut Selection (CTRL+X)
Copies the current selection to the clipboard and deletes the selection. It can also be accessed by clicking on the
 icon of the edit toolbar. The command currently works for spreadsheets and for 2D plots objects.
- Edit → Copy Selection (CTRL+C)
Copies the current selection to the clipboard. It can also be accessed by clicking on the
 icon of the edit toolbar. The command currently works for spreadsheets and for 2D plots objects.
- Edit → Paste Selection (CTRL+V)
Pastes the content of the clipboard to the active window. It can also be accessed by clicking on the
 icon of the edit toolbar. The command currently works for spreadsheets and for 2D plots objects.
- Edit → Delete Selection (del)
Cleares the current selection. It can also be accessed by clicking on the
 icon of the edit toolbar. The command currently works for spreadsheets and for 2D plots objects.
- Edit → Delete Fit Tables
-
Each time yo do a fit of your data with some mathematical model, a new table is created to put the results of the fit (i.e. the values computed by the model). These tables can be used to plot comparisons of experimental and fitted values.
If you have done several fitting tentatives, a number of unused table may be present in your project. This command allows to remove the results of all the differents fits that you have tested.
- Edit → Clear Log Information
Deletes from the project file all the history information about the analysis operations performed by the user (fitting, integrations, etc). The log panel is then empty. If your project is reload from a file, all the fitting will be done again and the log-panel will be filled.
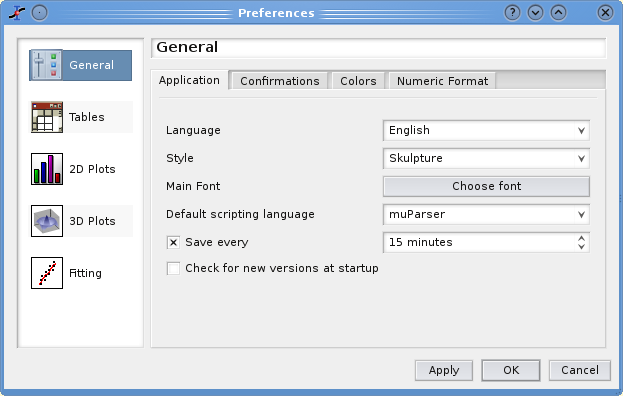
- Edit → Preferences
-
The preference dialog is used to customize the application. It has five different tabs. If you confirm your changes to the default behaviour of the application, the changes are saved and stored imediatelly.
The first icon can be selected to change the General options of the application. In the first tab: Application, the style is the general decoration used for the windows. It defines the aspect of the buttons and dialog boxes, as an example all screenshots presented in this manual have been done with the Cleanlooks style available in KDE. The available styles are part of the Qt library. The font is the general font used for the GUI (menus, dialogs, etc), it doesn't apply to the plots. You can select the language of the application in the corresponding combo-box. All the available translations can be downloaded from the following address: Sourceforge repository, you can also use the Translations command from the Help menu.The translated messages are in a file with the extension .qm which must be placed in a folder called share/translations/, situated in the same location as the SciDAVis executable, in order to be loaded by the application.
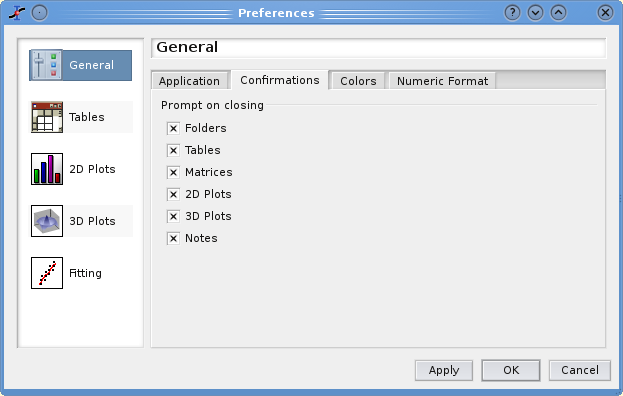
The second tab of the General option set is used to disable the prompting on deleting of objects.
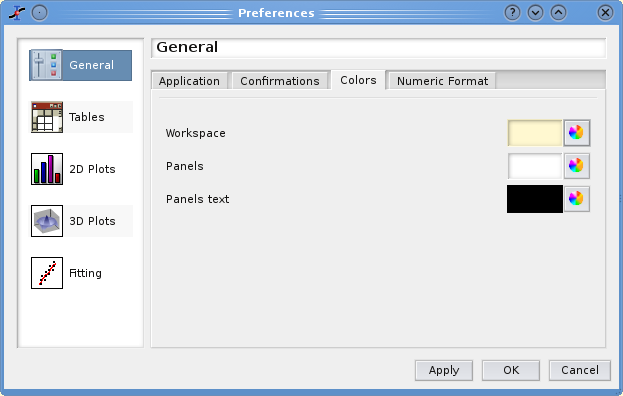
In the third tab, you can change the default color for the workspace of the application. You can also choose the background color and the text color for panels. The panels are the Log Window (activated by the Results Log command) and the Project explorer (activated by the Project Explorer command.
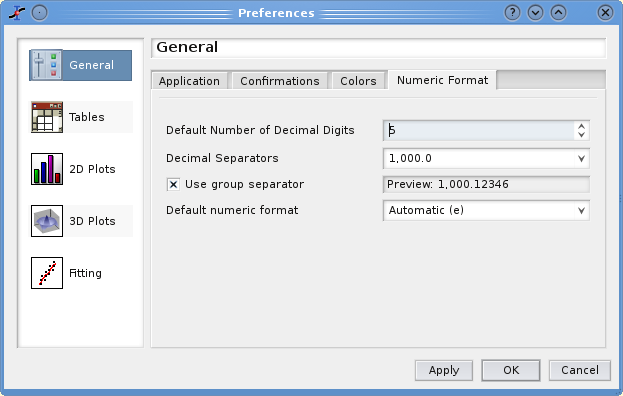
The last tab is use to set the default format for numbers. This format will be used in any new table of matrix. If you check the Update... option, the decimal separator of the numbers already present in tables will be modified.
The other icons can be used to define the default behaviour of specific objects. Refer to the corresponding sections for more details: tables, 2D links, 3D links and Fitting.