- View → Toolbars
-
There are seven toolbar which can be used to quickly access to the different functions.
In most cases, they are present automatically when necessary.
- View → Plot Wizard (CTRL+ALT+W)
-
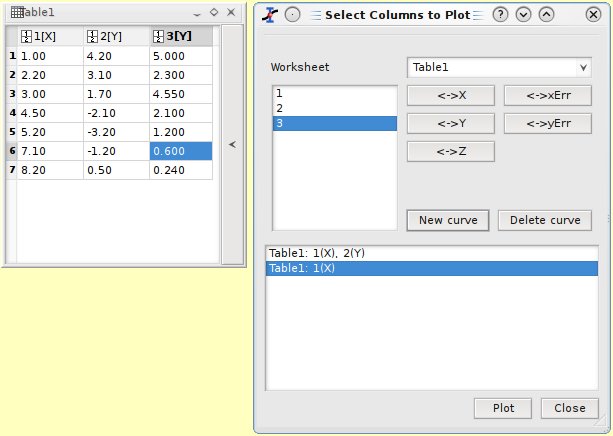
This dialog is used to build a new plot by selecting the columns in the tables available in the current project. At first, you have to select the table you want to use, and then click on New curve to create the curve. After that, you have to select at least one column for X and one for Y. You can also select one more column for X-errors or for Y-errors. The plot created will have the default style you defined using the 2D plot preferences dialog through the '2D Plots -> Curves' tab.
Figure 5.10. The plot wizard dialog box.
In this example, one curve is selected from the first table, and the other from the second table (with X error bars)
- View → Project Explorer (CTRL+E)
-
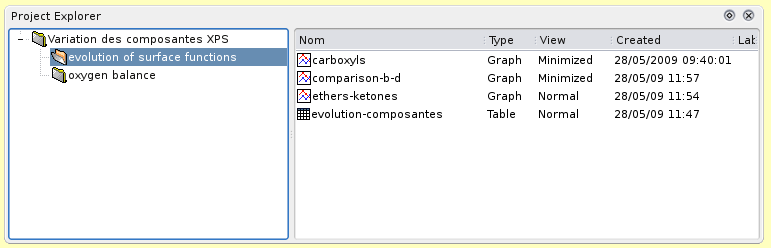
Opens/Close the Project Explorer, which gives an overview of the structure of a project and allows the user to perform various operations on the windows (tables and plots) in the workspace.
The project explorer shows a list of all the windows, tables, matrices and folders which are included in the current project. It can be used to create new folders and windows, to find existing ones, to make hidden elements visible, to perform basic operations like: renaming, deleting, hiding, resizing, printing, etc... You can also use it in order to display the list of dependencies and properties of an element in the project.
- View → Results Log
Opens/Close a panel displaying the historic of the data analysis operations performed by the user.
- View → Undo/Redo History
-
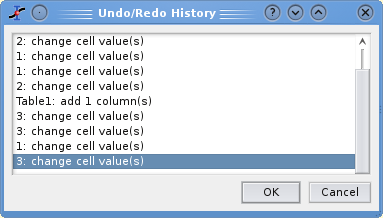
This command shows a window which contain all the command which have been done on tables and matrix during the session.
- View → Console
-
.